False Color
A method of representing data where colors are assigned to specific ranges of values, often used in astronomical imaging to visualize wavelengths outside the visible spectrum.
Source: earthobservatory.nasa.gov
APODs including "False Color"
A Long Storm System on Saturn
15/09/2019
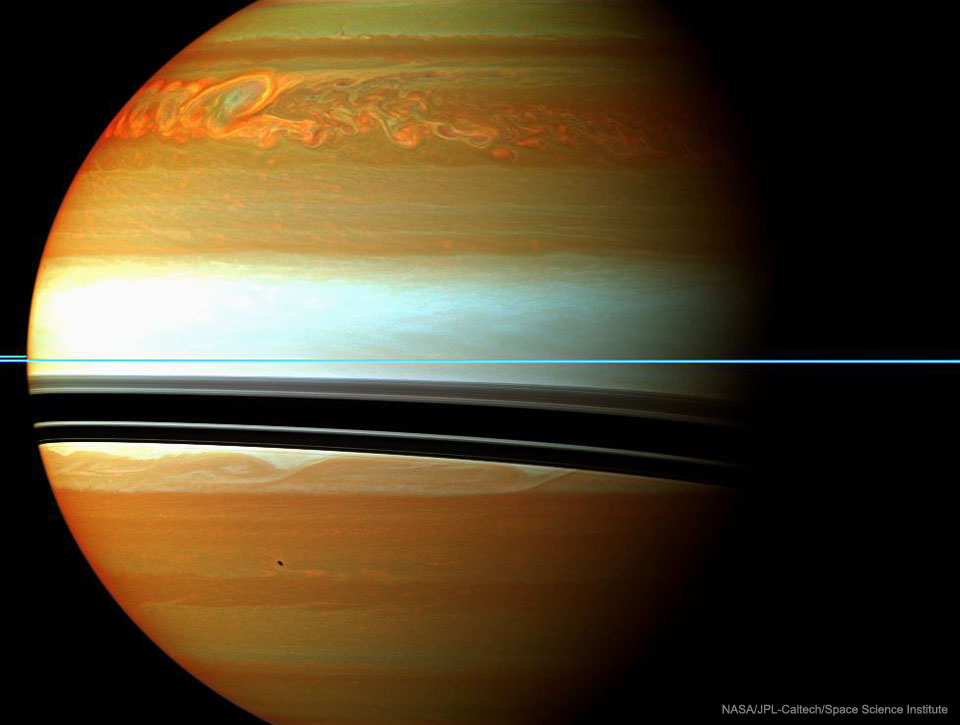
It was one of the largest and longest lived storms ever recorded in our Solar System. First seen in late 2010, the above cloud formation in the northern hemisphere of Saturn started larger than the Earth and soon spread completely around the planet. The storm was tracked not only from Earth but from up close by the robotic Cassini spacecraft then orbiting Saturn. Pictured here in false colored infrared in February, orange colors indicate clouds deep in the atmosphere, while light colors highlight clouds higher up. The rings of Saturn are seen nearly edge-on as the thin blue horizontal line. The warped dark bands are the shadows of the rings cast onto the cloud tops by the Sun to the upper left. A source of radio noise from lightning, the intense storm was thought to relate to seasonal changes when spring emerges in the north of Saturn. After raging for over six months, the iconic storm circled the entire planet and then tried to absorb its own tail -- which surprisingly caused it to fade away.