Star
A star is a massive, self-luminous sphere of plasma held together by its own gravity. It shines by converting hydrogen into helium through nuclear fusion in its core, releasing energy across the electromagnetic spectrum.
Stars form in large clouds of gas and dust—called nebulae—where regions collapse under gravity, creating protostars. When core temperatures reach millions of degrees, fusion ignites, marking the birth of a star. Observatories like Hubble and missions such as NASA’s Infrared telescopes have imaged this process in action.
The majority (~90%) of stars are main-sequence stars, fusing hydrogen into helium. These include a broad range of masses—from red dwarfs (small, long-lived, faint) to blue giants and supergiants (massive, hot, and short-lived). Our Sun is a middle-aged G-type main sequence star.
As stars exhaust their hydrogen fuel, their evolution depends on mass. Lower-mass stars become red giants then white dwarfs. More massive stars undergo successive fusion stages, end in supernova explosions, and leave behind neutron stars or black holes.
Stars vary in brightness, size, and color. They are classified using spectral types (O, B, A, F, G, K, M) based on surface temperature and absorption lines. For example, O- and B-type stars are hot and blue; M-type are cool and red.
Stellar remnants include white dwarfs (Earth-sized cores of former stars), neutron stars (city-sized remnants of supernovae), and black holes (extreme-density objects from the most massive stars).
Stars are not static—many rotate, exhibit magnetic activity (like sunspots and flares), and broadcast stellar winds. Their lifecycle enriches the interstellar medium with heavier elements, seeding future generations of stars and planets.
Stars often exist in groups—binary or systems within star clusters and galaxies. Their properties are studied via brightness, spectra, parallax, variability, and statistical surveys by missions like Gaia and Kepler.
Sources
APODs including "Star"
Opportunity's Mars Analemma
16 May 2014
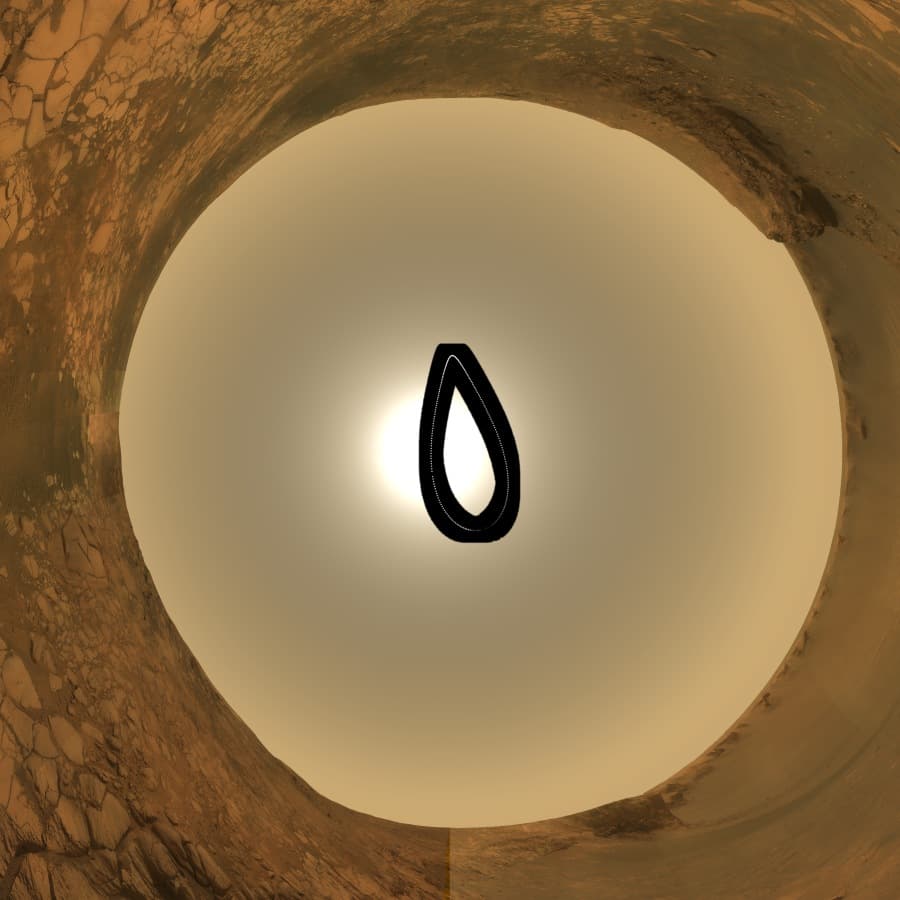
Staring up into the martian sky, the Opportunity rover captured an image at 11:02 AM local mean time nearly every 3rd sol, or martian day, for 1 martian year. Of course, the result is this martian analemma, a curve tracing the Sun's motion through the sky in the course of a year (668 sols) on the Red Planet. Spanning Earth dates from July, 16, 2006 to June 2, 2008 the images are shown composited in this zenith-centered, fisheye projection. North is at the top surrounded by a panoramic sky and landscape made in late 2007 from inside Victoria crater. The tinted martian sky is blacked out around the analemma images to clearly show the Sun's positions. Unlike Earth's figure-8-shaped analemma, Mars' analemma is pear-shaped, because of its similar axial tilt but more elliptical orbit. When Mars is farther from the Sun, the Sun progresses slowly in the martian sky creating the pointy top of the curve. When close to the Sun and moving quickly, the apparent solar motion is stretched into the rounded bottom. For several sols some of the frames are missing due to rover operations and dust storms.